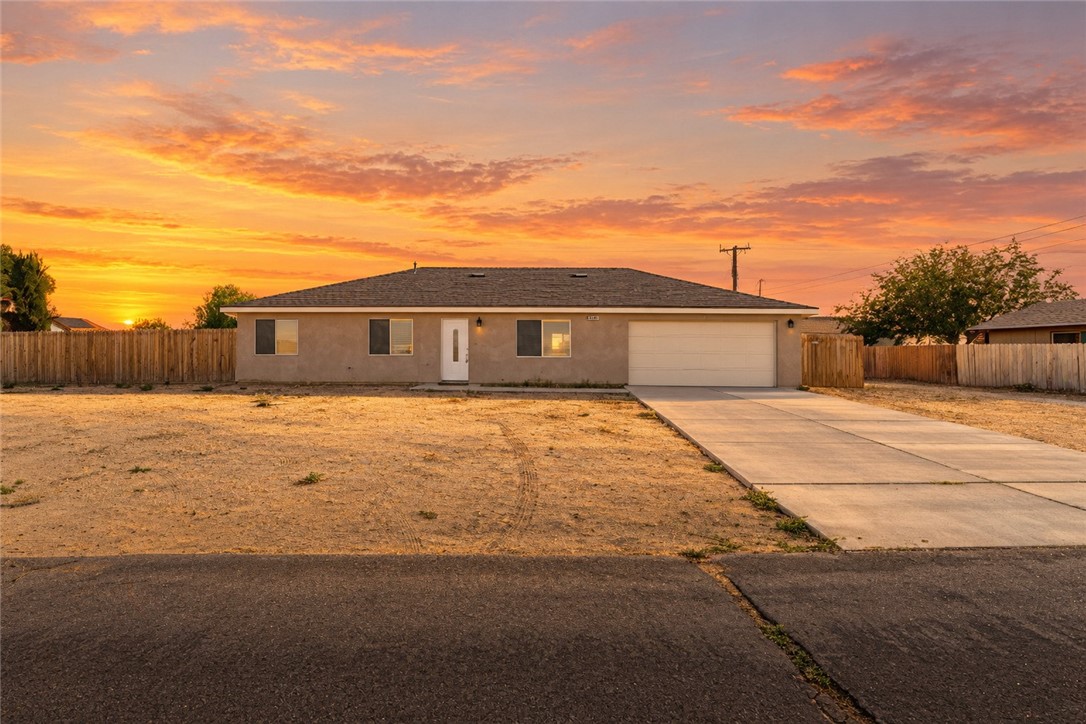
10016 Mendiburu, California City, CA 93505
10016 Mendiburu, California City, CA 93505
Property Description
Get the look and feel of new construction without paying the new construction premium. Built in 2021 and kept in immaculate condition, 10016 Mendiburu is a great alternative to paying top dollar for a brand new 2026 build. One of the biggest bonuses is the paid off solar, which means you get the energy savings without a monthly solar payment. The home faces the Mojave Desert, giving you wide open views and endless Southern California scenery right outside your door. This home checks a lot of boxes for first time buyers, investors, and military buyers alike. It's affordable, newer construction, move in ready, in great condition, and offers incredible views. It's also located within commuting distance of Edwards Air Force Base. If you've been waiting for the right opportunity to get into a newer home at a great price, this is the one to see!
Features & Amenities
Property Details
Mortgage Calculator
Current Rates
Comparative Market Analysis
Affordable Tier · 5 active · 5 closed
California City · Single Family Residence
Listed in line with the median closed sale of $300,000.
Price Position
Aligned with the market — fair pricing for the comps.
Active Properties (5)
Active Comparables
| Address | City | Year | BD | BTH | SqFt | LotSz | LP/SqFt | LP | DIM | Score |
|---|---|---|---|---|---|---|---|---|---|---|
| 21648 95th | California City | 2007 | 3 | 2 | 1,656 | 10,253 | $171 | $282,900 | 65 | 80 |
| 10611 Garibaldi | California City | 1990 | 3 | 2 | 1,500 | 10,495 | $177 | $264,900 | 44 | 79 |
| 9425 Evelyn Avenue | California City | 2005 | 3 | 3 | 1,796 | 10,001 | $189 | $339,990 | 10 | 76 |
| 21481 Randsburg Mojave | California City | 1989 | 3 | 2 | 1,676 | 10,493 | $200 | $334,900 | 10 | 74 |
| 21432 Keller Court | California City | 2004 | 4 | 2 | 1,948 | 12,857 | $177 | $343,900 | 102 | 74 |
| Total: 5 · Average | 3.2 | 2.2 | 1,715.2 | 10,819.8 | $182.8 | $313,318 | 46.2 | |||
| Median | 1,676 | $334,900 | ||||||||
Closed Properties (5)
Closed Comparables
| Address | City | Year | Date | BD | BTH | SqFt | LotSz | LP | SP | SP/SqFt | SP/LP | DIM | Score |
|---|---|---|---|---|---|---|---|---|---|---|---|---|---|
| 10130 Evelyn | California City | 1988 | 10/16/2026 | 3 | 2 | 1,569 | 11,326 | $279,900 | $270,000 | $172 | 0.96 | 49 | 83 |
| 10549 Camille Court | California City | 2023 | 05/14/2026 | 3 | 2 | 1,508 | 8,461 | $319,000 | $319,000 | $212 | 1.00 | 157 | 82 |
| 9309 Margery Avenue | California City | 2020 | 08/03/2026 | 3 | 2 | 1,206 | 10,019 | $314,900 | $310,500 | $257 | 0.99 | 38 | 82 |
| 21745 Upton Drive | California City | 2007 | 04/24/2026 | 3 | 2 | 1,514 | 9,320 | $305,000 | $300,000 | $198 | 0.98 | 142 | 79 |
| 9413 Karen | California City | 2004 | 07/31/2026 | 3 | 2 | 1,504 | 7,562 | $286,500 | $276,500 | $184 | 0.96 | 36 | 78 |
| Total: 5 · Average | 3.0 | 2.0 | 1,460.2 | 9,337.6 | $295,200 | $295,200 | $204.6 | — | 84.4 | ||||
| Median | 1,508 | $300,000 | $300,000 | ||||||||||
Market Analysis
List vs Sale $/SqFt
Sale Price Trend
Days on Market
Sale vs List Price
This analysis was generated automatically from MLS data. For an in-depth, human-reviewed valuation, contact Joseph Sardella at josephsardella@gmail.com.